From NeOn Wiki
Plugin for OWL Ontology Visualization
Contents
|
Functional Description
This plugin adds a new visualization paradigm to the NeOn toolkit. The plugin provides a navigation based on the relations contained in the classes of the ontology.
- Visualize classes with its relations
- Graphically Navigation through ontology classes
Usage Documentation
Installation
Manual Installation
You can install the Ontology Visualization plugin such as other plugins in Eclipse.
First, you have to download the Ontology Visualization plugin from the repository. You can download the plugin and help files from the Versions & Compatibility section; if you are using the Neon Toolkit you have to close it. Then unzip the file into the [Neon Toolkit path]. Also you can download the help plugin to have this help in the eclipse menu Help > Help contents .
If you open the Neon Toolkit now you have access to the new Ontology Visualization View and perspective.
In some case with this installation the neon toolkit does not recognize your plugin if it the case you should lunch the neontoolkit in the line command and add the parameter -clean
Installation from update site
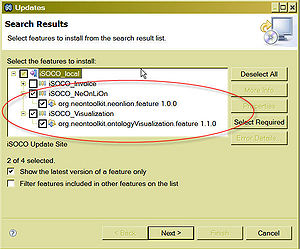
In the NeOn Toolkit, click on: Help > Software updates > Find and Install... . Search for new features for install and create New Remote Site with name=iSOCO and URL=http://www.isoco.com/ontologies/neon/org.neontoolkit.isoco.updateSite/ . Select the iSOCO site created and click on the Finish button. Select the org.neontoolkit.ontologyVisualization.feature and install it.
Since version 1.1.0 you have to select the org.neontoolkit.NeOnLiOn feature from the iSOCO update site as it is shown in the image below:
GUI
Show Ontology Visualization perspective
First of all, we explain what is the diference between a perspective and a view. The view is just a pane allowing you to use the resources. A perspective is useful in organizing various views around the editor area, these are also helpful in managing menus and toolbars.
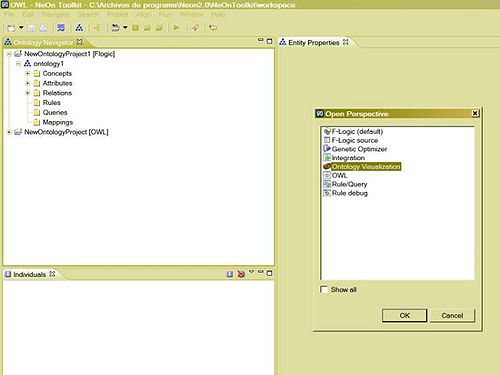
Go to Window > Open perspective > Other . This opens the window shown in the next figure and then click on Ontology Visualization . Then you can see the new perspective with the Ontology Visualization view.
You can also open the Ontology Visualization view in the OWL Perspective as you can see in the next section
Show Ontology Visualization view
Go to Window > Show view > Visualization. This opens the window shown in the next figure and then click on Other > Ontology Visualization. Then you can see the new Ontology Visualization view forming part of the OWL perspective.
Show classes in graph
First steps
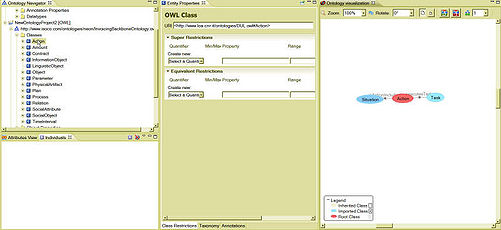
To create a graph select a class from the Ontology Navigator (Remember that this plugin is only for OWL Ontologies). When you select a class, the graph loads the class with its relations.
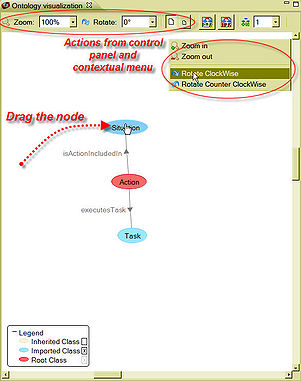
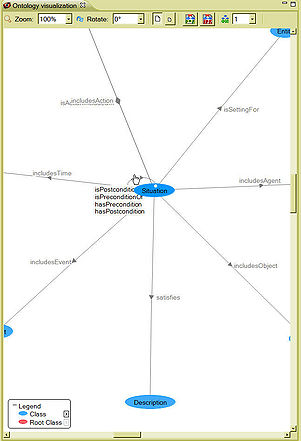
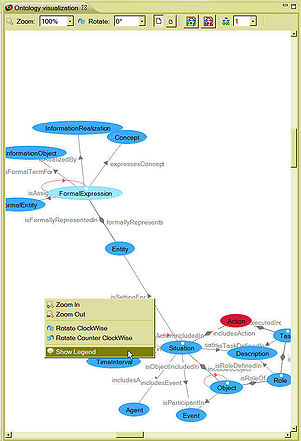
If you experience problems visualizing the graph (like in the image above where we cannot see relations), you can drag a node class to another position, rotate the graph, enlarge or reduce it by clicking the right mouse button which opens the contextual menu (as shown in the next figure). The control panel offers the same functionalities.
Expanding and collapsing node classes
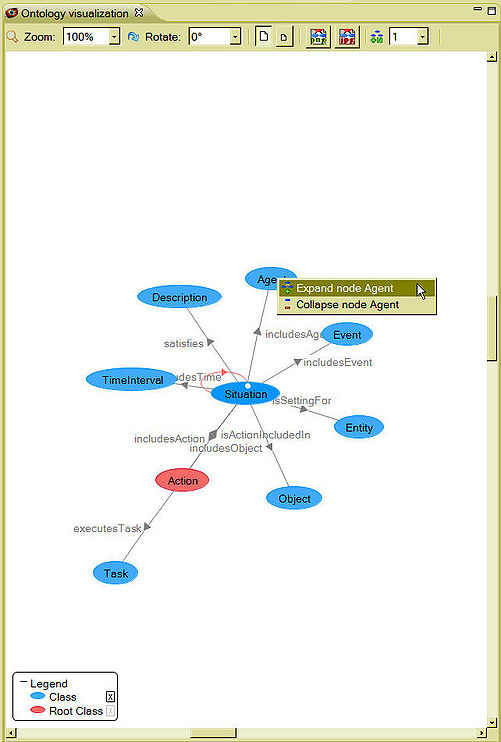
You can expand or collapse nodes double-clicking on a class. Relations with other classes will be shown in the graph. A white circle in the graphical representation of the node indicates its expansion. Clicking on the class with the right mouse button opens the contextual menu, where you can also expand or collapse nodes.
The Root Node (it is the node selected from the navigator) cannot be expanded or collapsed. You can select a new Root Node from the Ontology Navigator.
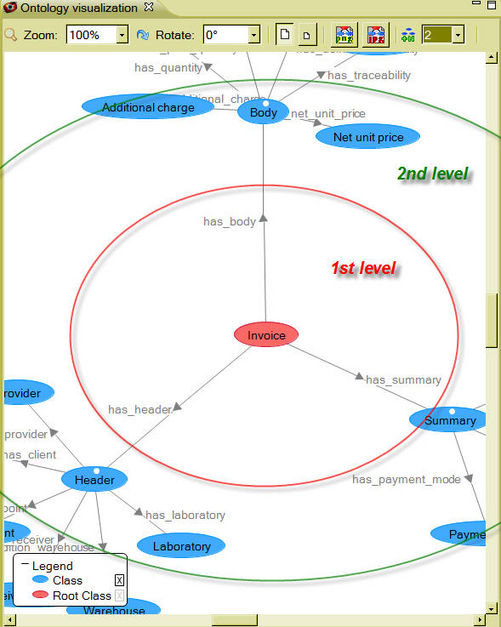
Expanding more than one level
You can expand more than one level by choosing the expansion level at the combo level in the Control Panel :
Showing Data Types
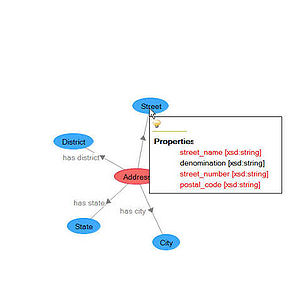
When you stop the cursor on a class node, a tooltip appears showing the Data Property relations. Relations with the minimal cardinality 1 are shown in red.
Circles
If a class node has relations with itself, it has a red loop edge. By clicking on this edge a tooltip appears with its relations.
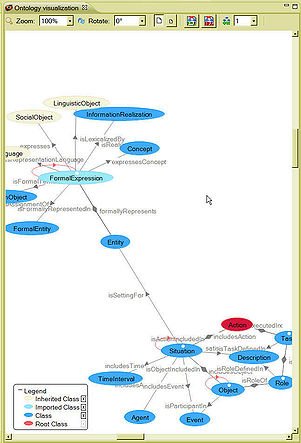
Node Types
There are four node types:
- Root Node (Red) : It is the node we selected before in the Ontology Navigator . We begin our navigation from here.
- Mandatory Node (Blue) : A node which has direct relations with an ontology node and belongs to the same ontology than the Root Node .
- Import Node (Light blue) : A node which has relations with an ontology node and does not belong to the same ontology than the Root Node .
- Inherit Node (Light brown) : A node which has relations with the parents of an ontology node.
Legend
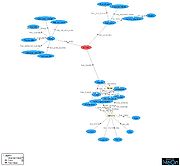
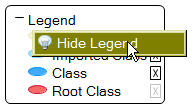
You can decide which types of nodes you want to visualize by choosing them in the legend. You can see the difference between the Graph 5 and Graph 8 figures when Inherit Node is selected or not from the legend. If you click the right button of the mouse you can hide the Legend
If the legend is hidden, click the right mouse button and select the option Show Legend .
Search Process
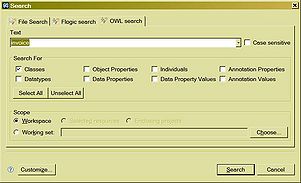
Maybe, with huge ontology, you want to use the search dialog for OWL Ontologies ( Search > Search and select the OWL Search tab ).
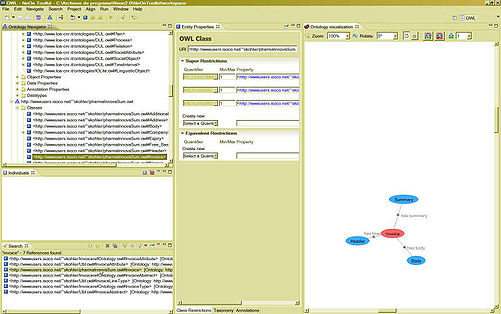
Double click a class from the search results and if you added the Ontology Visualization view to the OWL Perspective (Explained at this section) you can see this class in the Ontology Visualization view like in the next figure:
Exporting the visualization as an image
You can choose between PNG or JPG format selecting the desired buttom from the Control Panel .
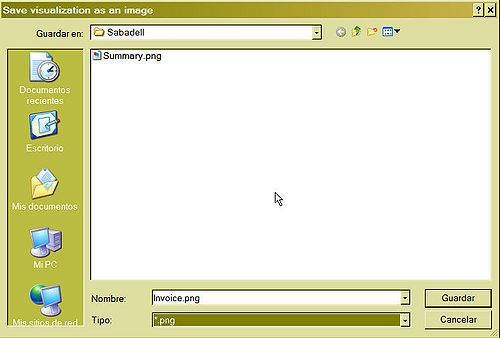
Select the path to save the image in the dialog box. (The name of the file is the root class name by default):
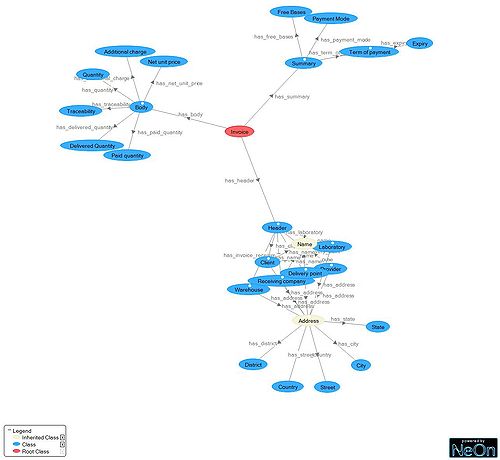
An example of an image exported:
Integration with the NeOn toolkit
The following extension points are used within the plugin:
1. Eclipse extension points:
- org.eclipse.ui.views
- org.eclipse.ui.perspectives
- org.eclipse.ui.popupMenus
- org.eclipse.ui.viewActions
- org.eclipse.help.toc
2. NeOn toolkit view contributions:
- com.ontoprise.ontostudio.gui.navigator.conceptActions
3. Plugins needed:
- org.neontoolkit.neonlion
The Eclipse Selection Service is used by this plugin. the Selection Service which is offered by the NeOn Toolkit architecture. The Selection Service has been chosen in order to interact the plugins and perform actions depending on the item that is transported by the selection service so there is a bidirectional communication between the plugin for OWL visualization and the Selection Service.
Limitations
The plugin show classes with their relations between other classes. The relations contemplated are:
- Object Domain -- Object Property --> Object Range
- Object Domain -- Data Property --> Data Type (As a class tooltip)
There are included inherited relations.
Only relations with the OR operator are contemplated.
Support
You can report bugs to Ricardo Melero (rmelero@isoco.com) and Víctor Méndez (vmendez@isoco.com).
Intended Use in Case Study
The plugin is part of the invoicing prototype. This type of visualization is used by the invoicing prototype along with other functionalities for annotating the invoices that are sent to a company. This visualization is used for presenting to the users an ontology in the most simple way as possible.
